Table of Contents
The Multi-dataset fitting interface can be used to fit multiple spectra using the same model and starting parameters for each spectrum. This interface can be accessed from the main menu of MantidPlot, in Interfaces → General → Multi-dataset Fitting. The interface consists of three major parts: The fit property window, the spectrum & fit viewer, and the list of spectra to operate on.
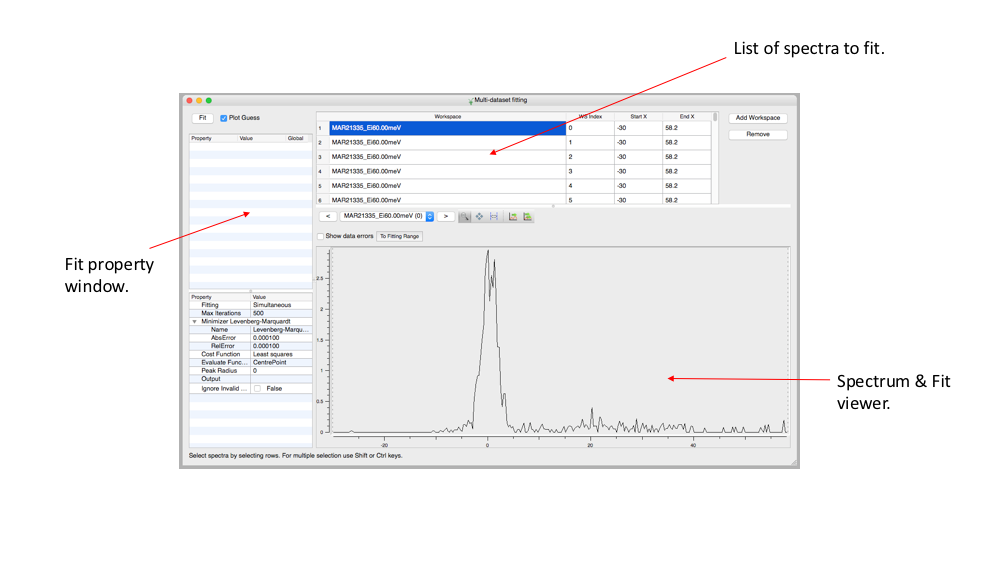
A high level overview of the various sections of the multidataset fitting interface.
To start fitting data with this interface some data of interest first needs to be loaded into the view. Using the “Add workspace” button you can choose a workspace to add spectra from. This will let you choose from a list of loaded workspaces and optionally select which workspace indices to include for fitting. Spectra can be removed by highlighting a corresponding row (or rows) and clicking “Remove”. To remove all spectra click the “workspace” column name and then click the “Remove” button.
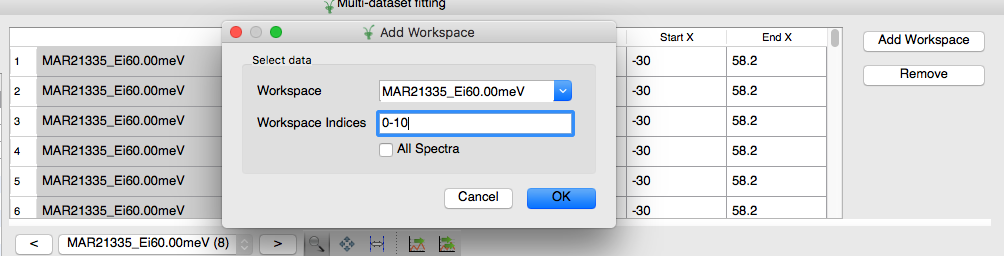
The dialog box shown after clicking “Add workspace”.
After a list of spectra have been imported from a workspace the table of spectra will be populated with one entry for each spectrum. Here you can see which workspace the spectrum came from, what the workspace index was, and what the start and end x values are for this particular spectrum for each fit. The start and end values are editable and can be changed by the user by double clicking on an entry.

The list of spectra after loading a workspace.
The fit property browser is located on the left of the interface. The operation of the fit property browser is very similar to the general fitting view available in Mantid but with slightly reduced functionality. The fit property browser is split into two major parts. The top panel allows the user to define the specifics of the model they wish to fit to the dataset. The bottom panel contains the parameters for the minimizer and general parameters not associated with the model (e.g. the number of iterations). The bottom panel also allows the user to choose between simultaneous and sequential fitting mode:
Another import general option in the bottom panel is the CreateOutput option (available in sequential mode). With this checked, as well as the output parameters, the fit will also output a workspace with the normalised covariance matrices and workspace with parameters for each spectrum. It will also output one workspace for each spectrum containing the data, fitted model, and difference between model and data.
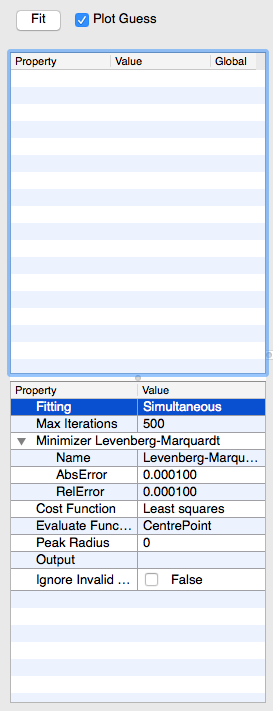
The fit property browser. The top panel contains the specifics of the model to fit. The bottom panel contains general parameters not associated with the model.
A model can be created by right clicking and choosing “Add function” in the top panel of the fit property window. This will produce a dialog box containing a large number of different fit functions which can be added to the model.

The dialog containing the list of fit functions that can be added to the model.
After adding a function a new entry will appear in the top left panel with the name of the fit function and a list of fitting parameters. The user can enter appropriate guesses at starting values for the model parameters. Once a model has been created the “Plot Guess” checkbox can be used to show a plot of the model in the spectrum viewer using the starting parameter. To fit the model click the “Fit” button.

The fit property browser with a model added. The browser shows the current starting values for each of the parameters of the model.
In the simultaneous fitting model parameters can be set as global. This means the same parameter will be shared across all spectra. To set a parameter as global click the checkbox in the “Global” column of the fit property browser next to the name and value of the model parameter.

Setting a model parameter to be global.
Model parameters can also be tied together or fixed to a given value. This can be done by right clicking on the parameter and choosing either “Tie” or “Fix”. A fixed parameter’s value will not change during a fit. A tied parameter can be used to either bound a parameter to a range or to tie the values of two parameters together.

Right clicking on a parameter shows the context menu with the fix, tie, and constraint options

Tieing the height parameter to the sigma parameter. More complex expressions are allowed. See the documentation in the Fit algorithm.
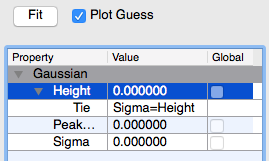
The fit property browser after the tie has been added to the parameter.
As well as setting the starting values for global parameters, the local parameter values of the model used for each spectrum can be set individually. The local parameter values can be edited by clicking on the value you wish to modify, then clicking on the “…” button next to the value. This will open a dialog of values for every spectrum. Here individual values can be set, fixed, and tied as with the global parameters.
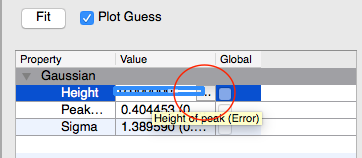
Button to open the window to edit local parameter values.
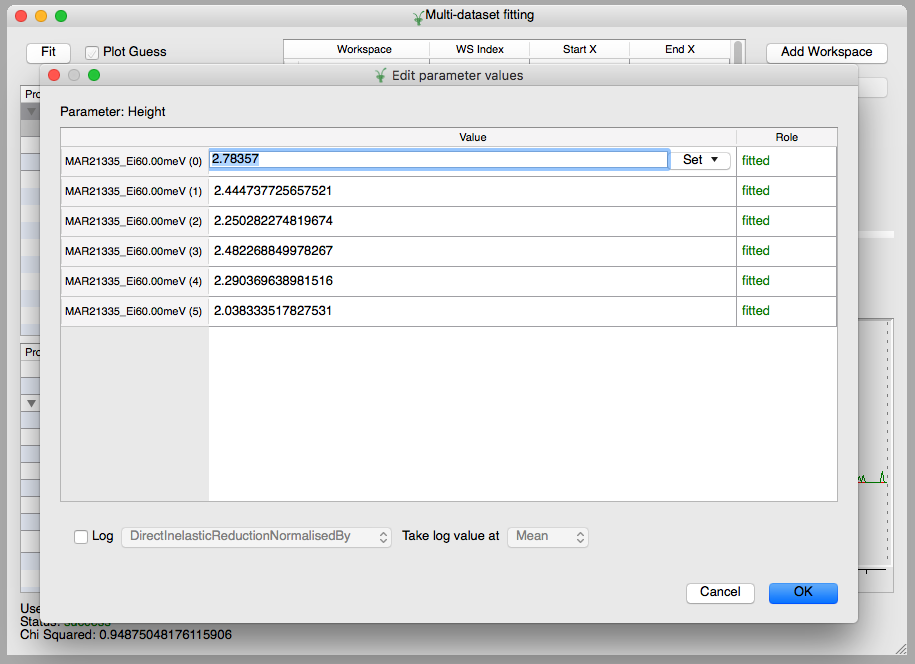
Editing local parameter values for each spectrum.
The spectrum viewer is shown in the bottom panel of the interface. This shows a plot of a single spectrum from the loaded list. It also shows a plot of the model with the current parameters overlaid on the spectrum. Using the buttons shown in the screenshot below the user can select which spectrum they wish to view. The plot is interactive and can be panned and zoomed.
The user can also interactively select x bounds either for a single spectrum or for all spectra by selecting the “Apply to all spectra option. To select x bounds click and drag the blue dashed vertical lines to move define the fitting window.
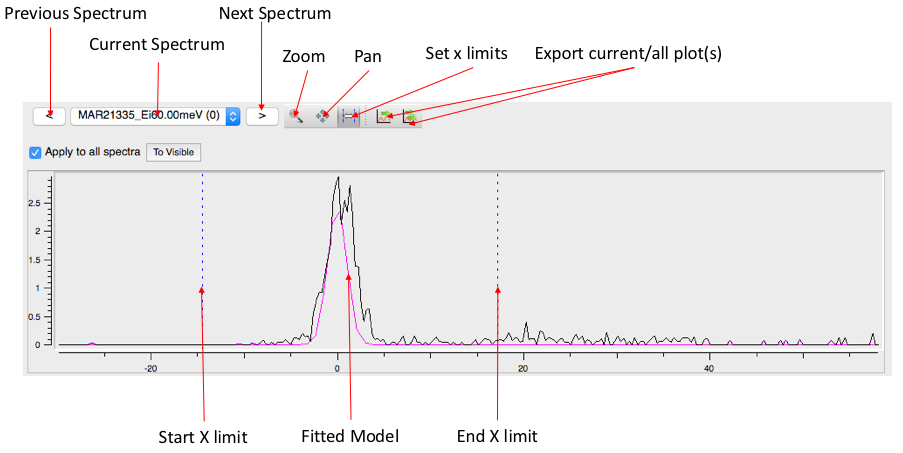
The spectrum view in the multidataset fitting interface.
Categories: Interfaces | Fitting